Land Report #7: Low Ground and Storm Flooding in Cherry Grove
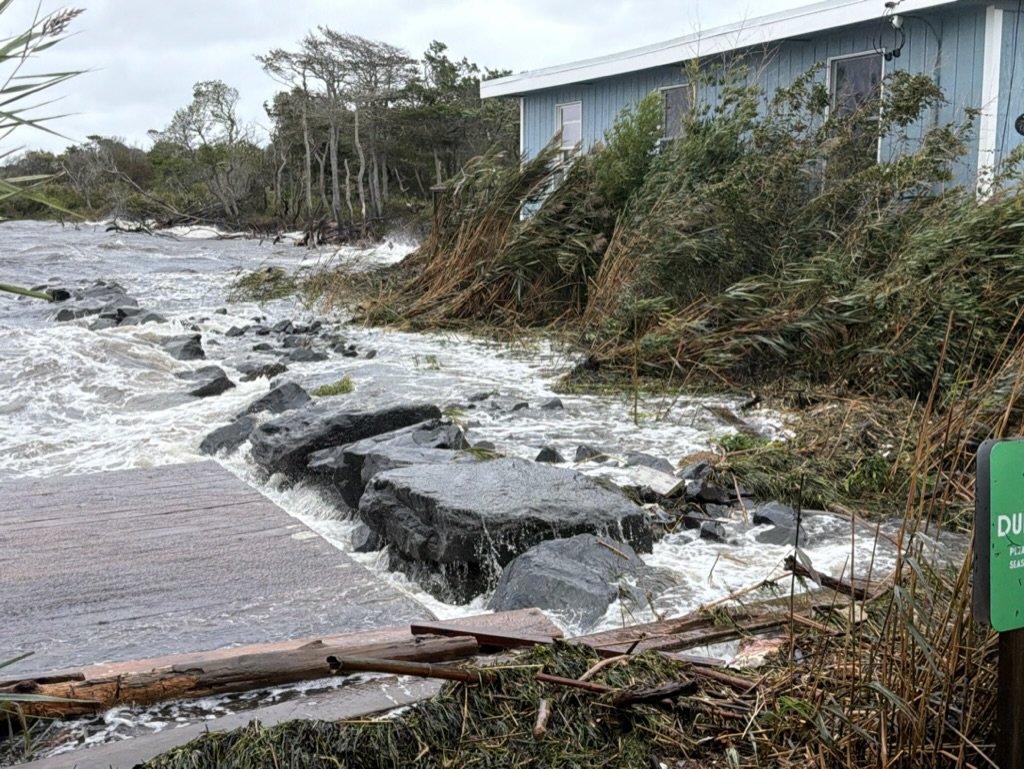
Bayview and Ivy Walk
Cherry Grove during and after the September 2026 nor’easter, September 26-29, 2026
I have lived in Cherry Grove year-round for ten years and tend many properties along these walks. In my experience, flooding of this kind comes once or twice a season, sometimes three times, though depth and extent vary.
Most of it happens in the off-season, when few people are here to see it. During September’s nor’easter, many residents were still on the island, watching water move through the community, a visible expression of the forces that shape life on a barrier island.
This report follows that water: where it appeared, where the bay entered, how separate pools connected, and how long it stayed.
The wetland beneath and between the properties
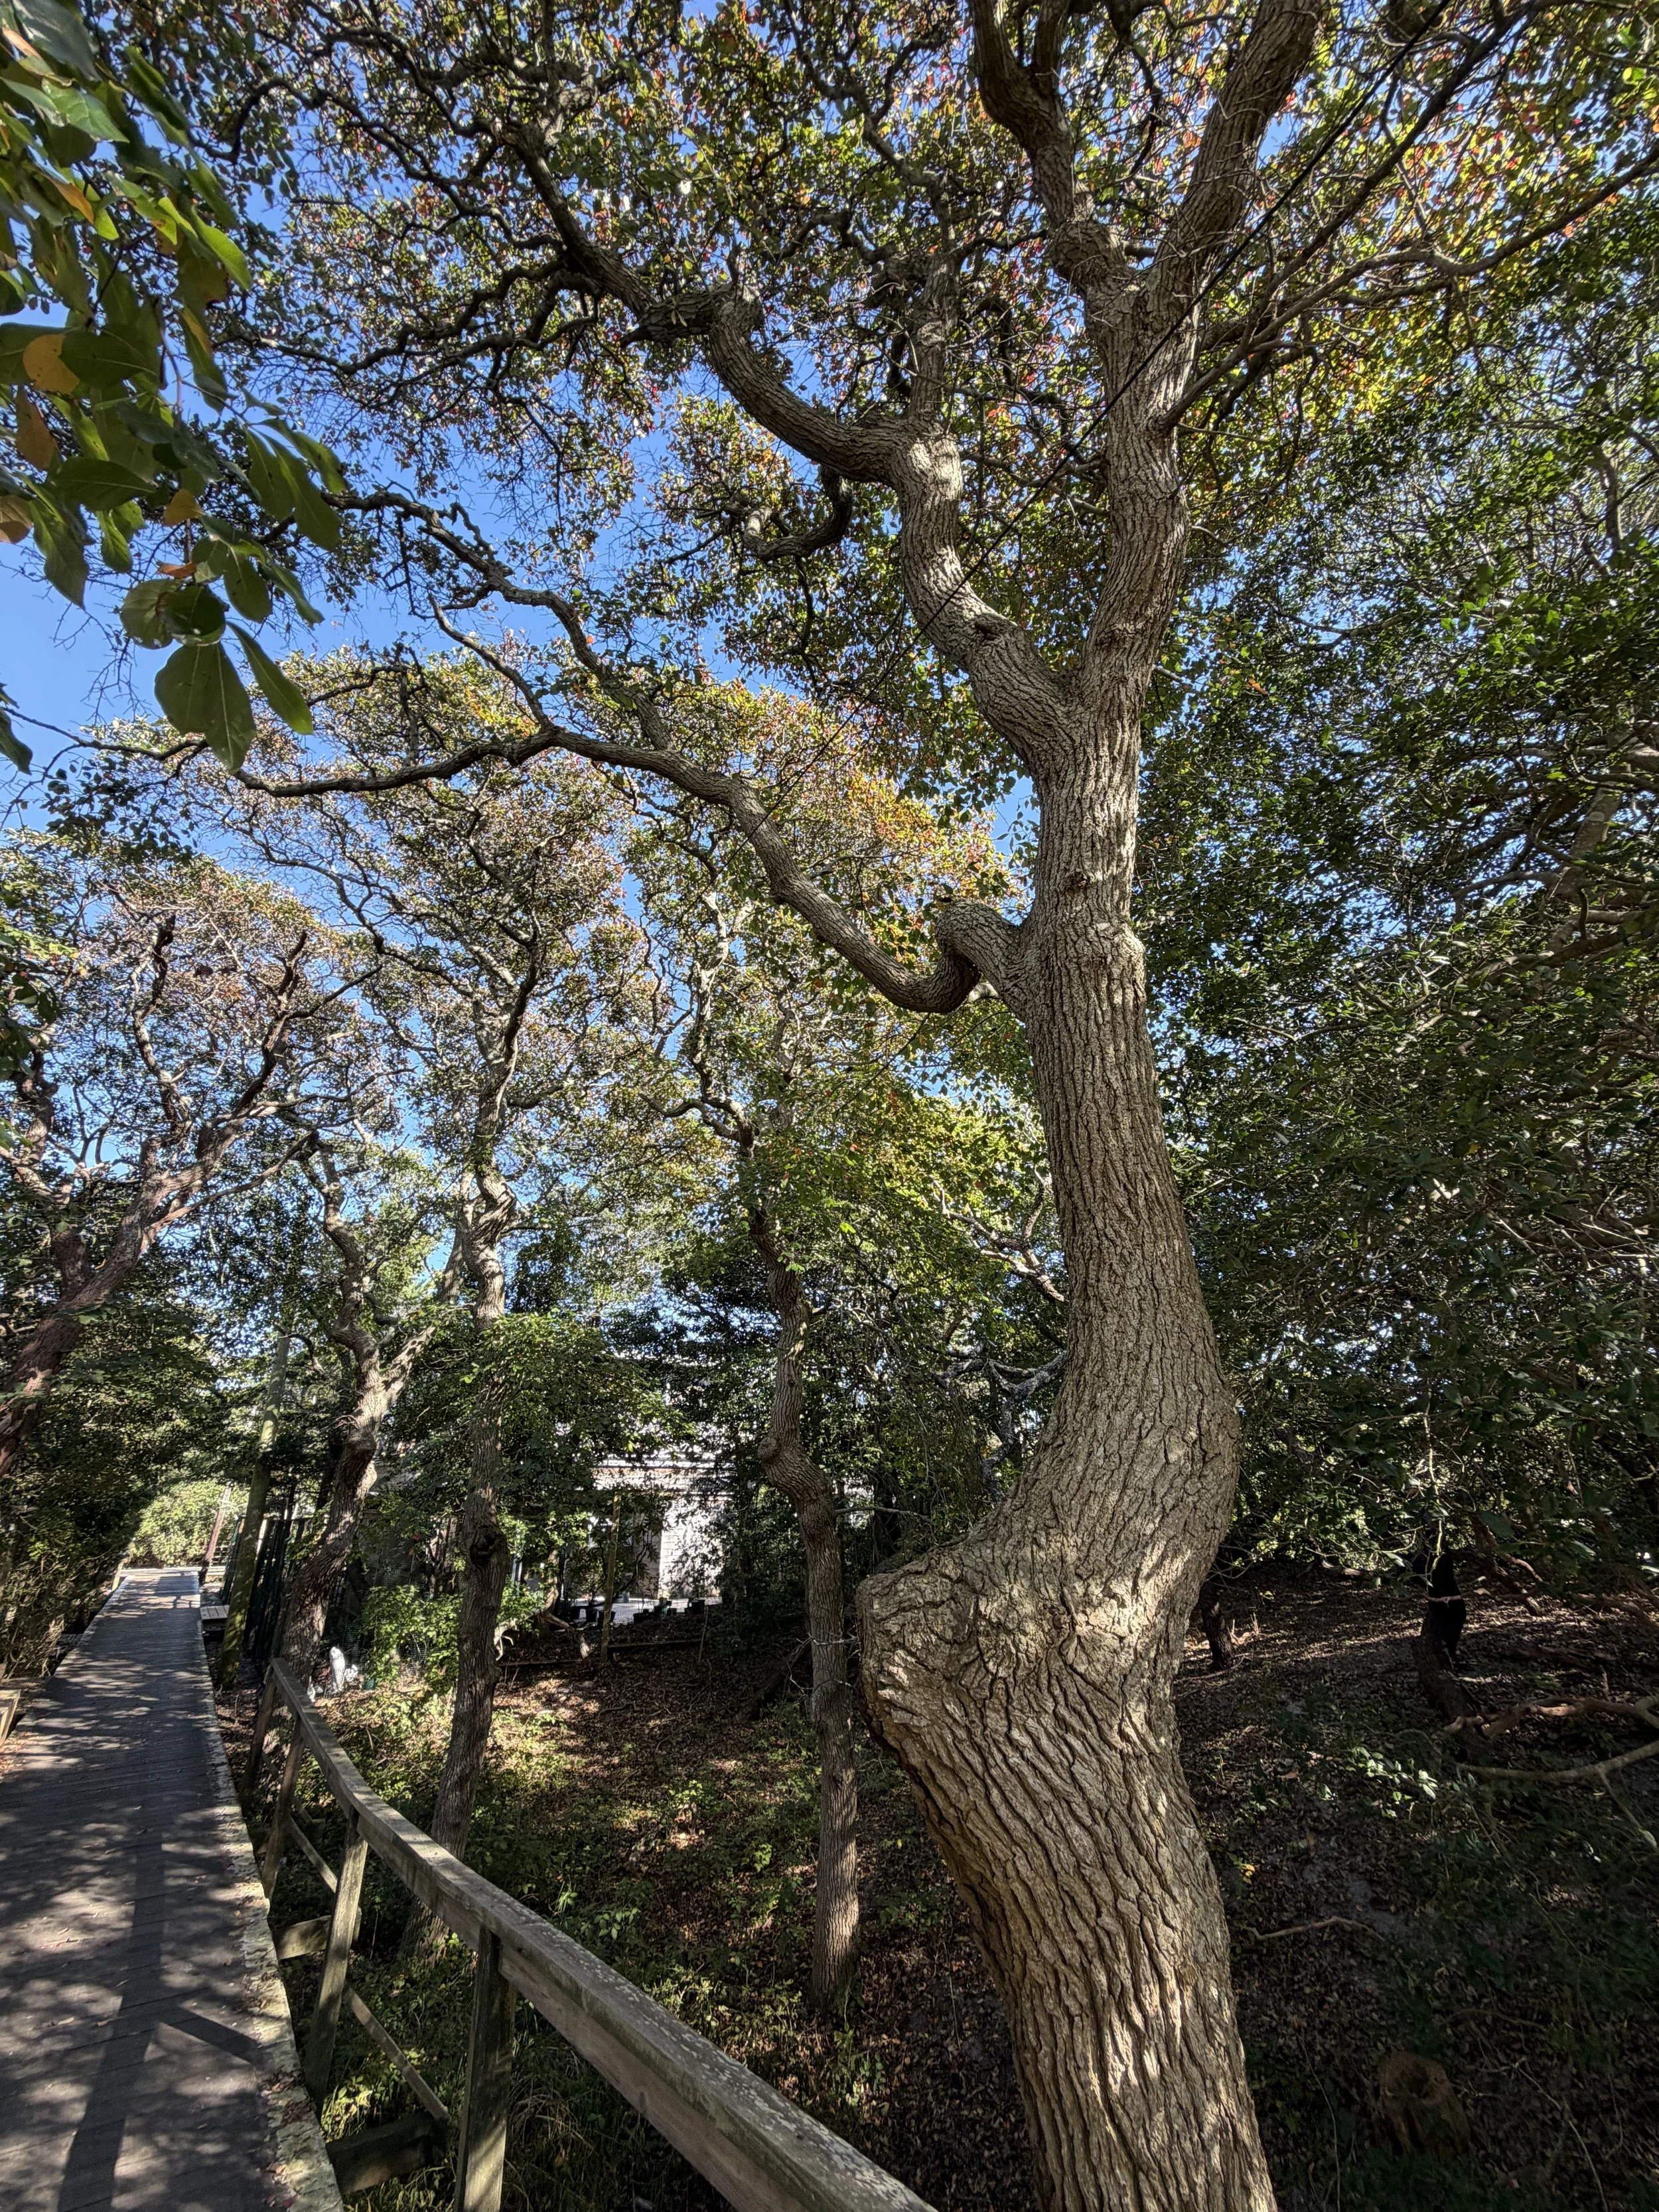
In ordinary periods of high groundwater, I see shallow water, sometimes an inch deep, in many of these yards. Wetland vegetation and recurring pools mark a pattern of low ground beneath and between the developed properties, mainly on the east side of Cherry Grove and at parts of the west end.
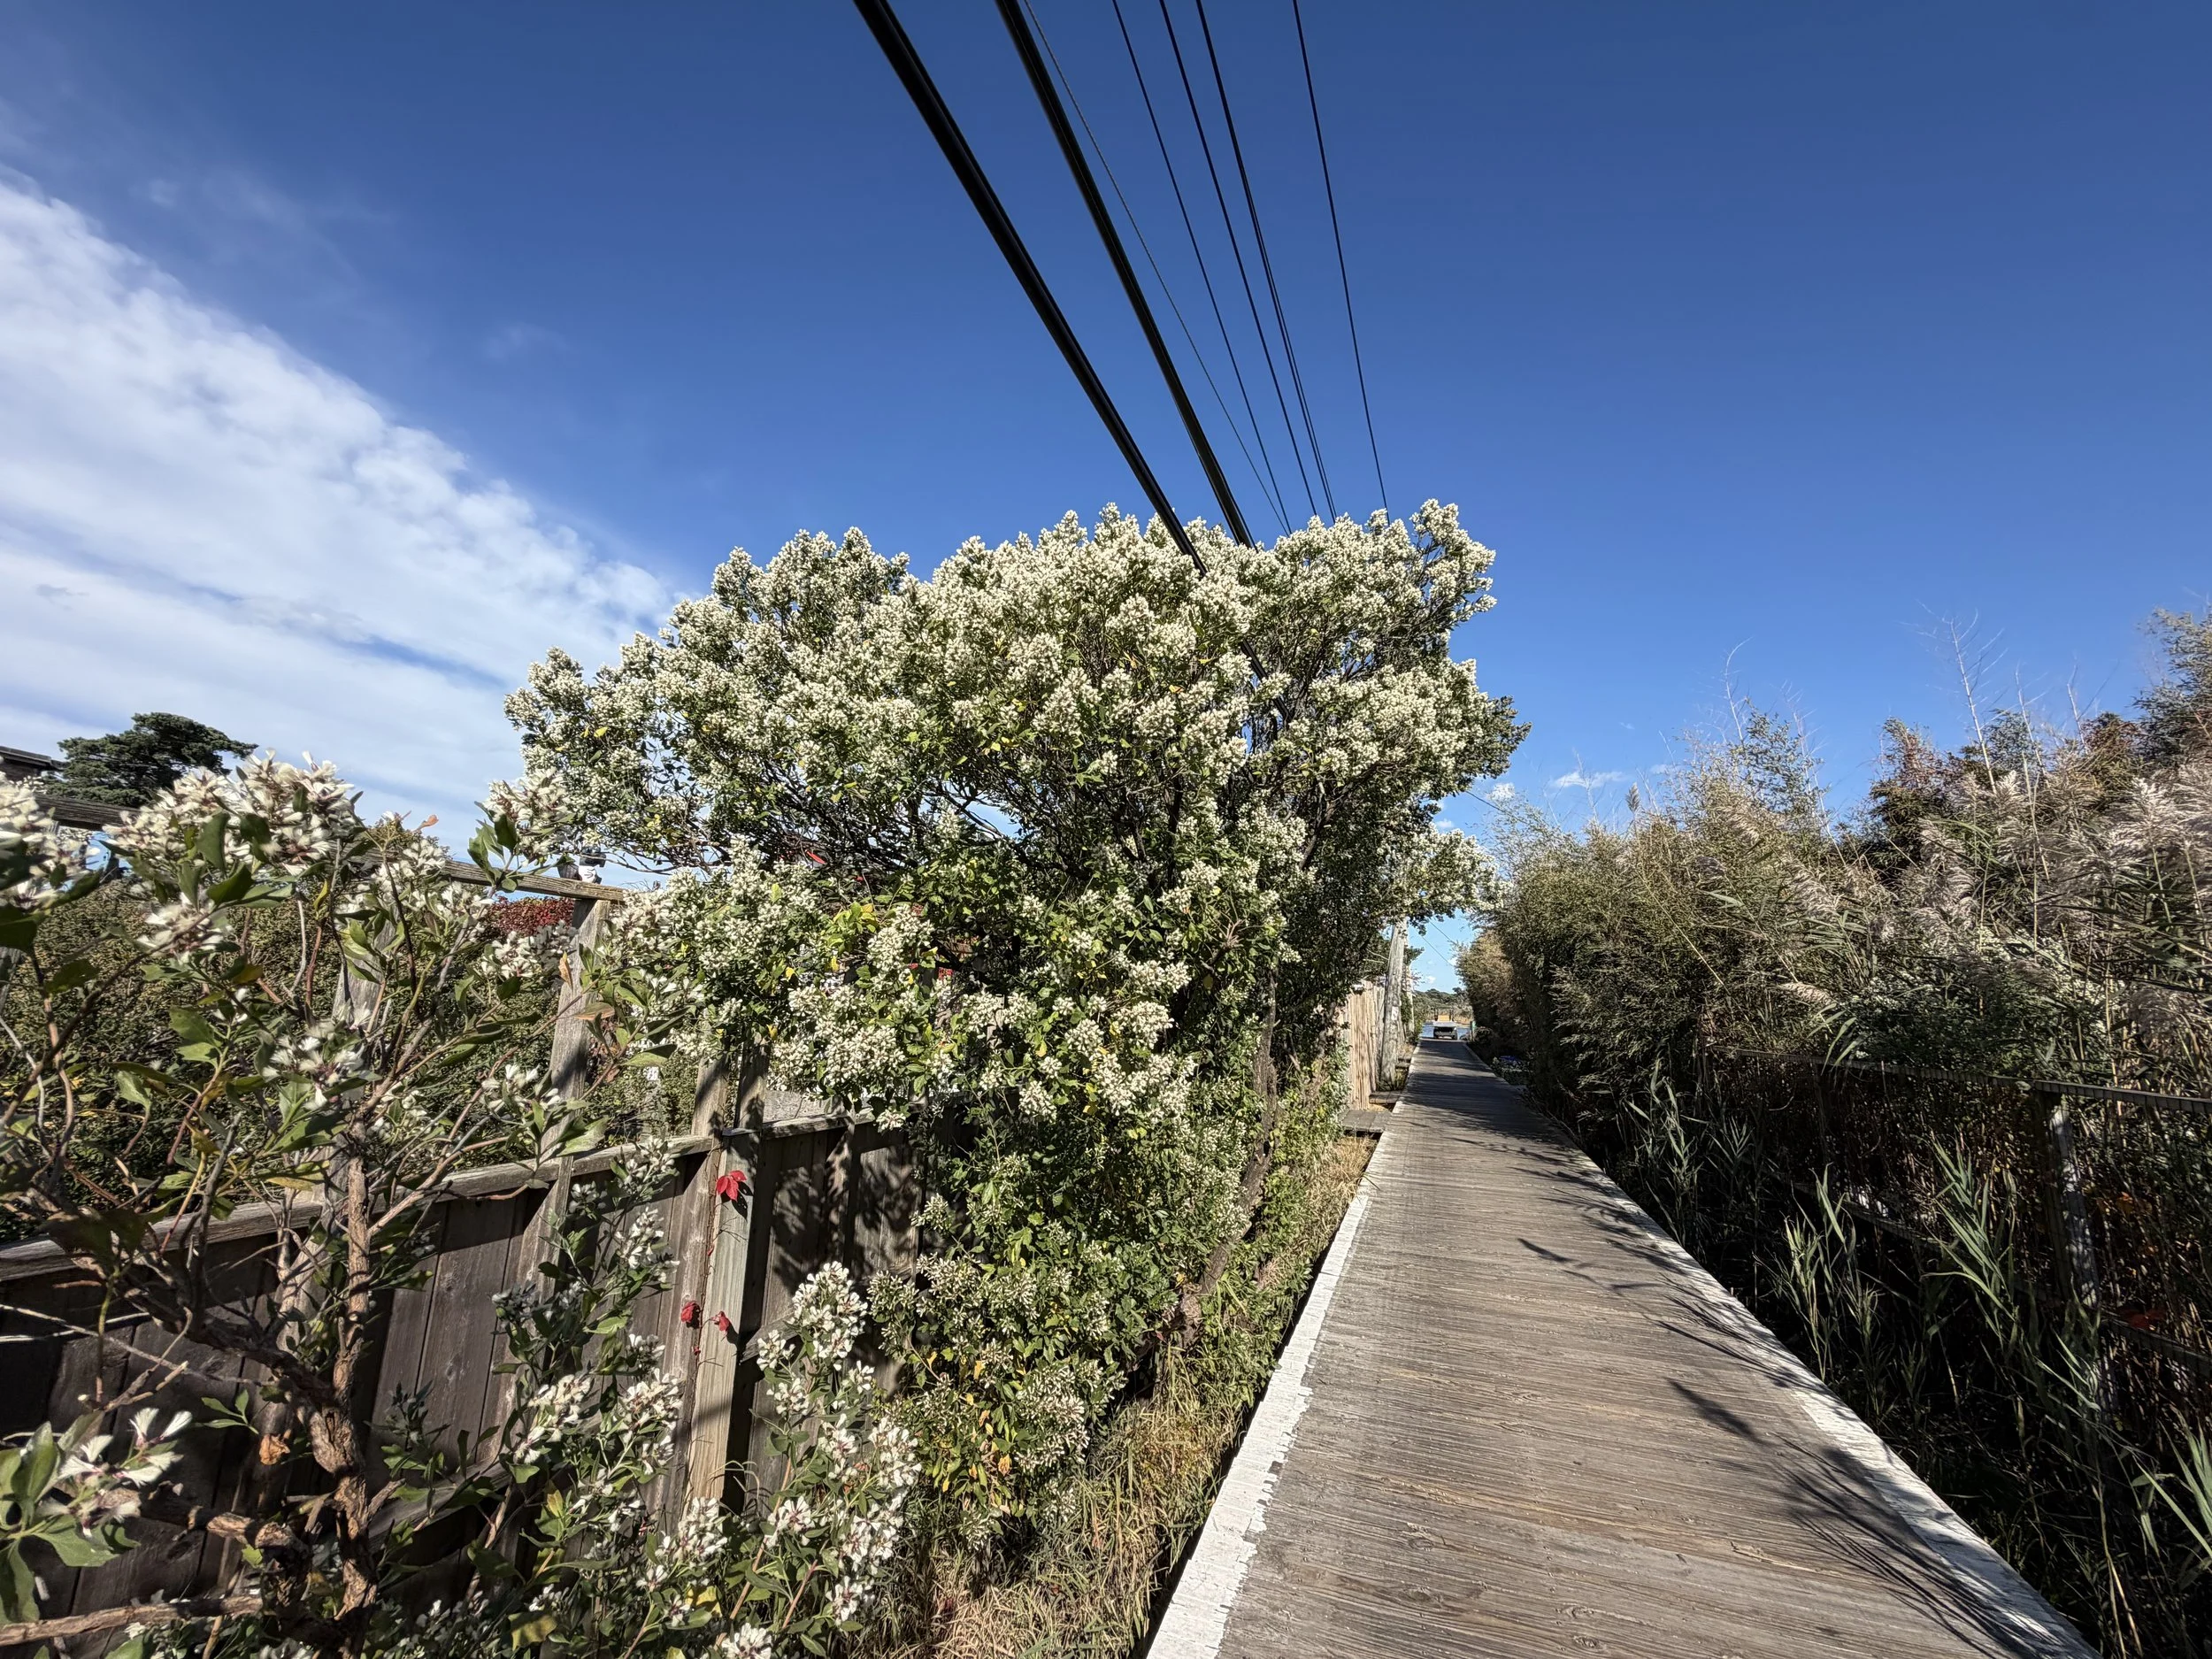
Native trees tell the story. Black Gum, for example, suggests that some of these depressions, or pannes, have been wet for a long time. Groundsel tree is another indicator of rising groundwater. It has been emerging over the last decade wherever it can keep its feet wet, along wetland edges that are widening as the climate changes. Of course, invasive Phragmites (common reed) is everywhere, spreading throughout the low-lying wetlands.
I read this as a wetland landscape whose continuity has become less visible through development. Walks and property lines divide our experience of the land, but water follows elevation and connection.
During the storm, this familiar pattern deepened. Pools that are normally shallow and separate became linked by water moving across the surface.
Where the water gathered
Beginning around midday on September 26, water covered properties on both sides of Bayview Walk, from Greene Walk to Ivy Walk. It extended south along the northern portions of Greene, Gerard and Aeon Walks, reaching the rise of the third dune.
Along Maryland and Sumner Walks, water reached almost to Lewis Walk. From Sumner toward the Carrington Tract, flooding appeared in patches along Lewis, and water filled low ground within the Carrington Tract.
In many affected yards I estimated depths of a foot or more. On Bayview, just before Gerard Walk, water reached about knee depth above the boardwalk at its worst.
Flooding varied from property to property. Higher ground stayed exposed while nearby depressions filled, revealing the uneven terrain beneath the community.
High tides and bay inflow
Strong winds, wave action and high tides pushed bay water over lower bulkheads during two high-tide cycles, spilling into yards along Bayview and adding to water already on the low ground.
There is a second entry point at the corner of Ivy Walk and Bayview. When a storm peaks at high tide, the bay can come over the walkway at this small corner and flood Bayview and Ivy Walk at higher elevations.
The sequence mattered. Water was in the low yards before the later pulse of bay inflow. Afterward, the flooding was deeper and more connected, forming a slow-moving surface stream.
I saw water move along Bayview toward Ivy Walk, and at other times back toward Greene. Some returned to the bay through openings in the bulkheads as levels fell. Some moved inland and pooled in the lowest areas. What I could see was the combined effect of groundwater, rainfall and bay inflow: water connecting yards, walks and wetland across a shared low landscape.
How the water receded
Deeper flooding and connected surface flow were most evident September 26-27. As winds eased and bay levels fell, the concentrated water spread across the low yards, leaving broader, shallower pools.
It did not disappear everywhere at once. Some areas cleared sooner, while lower ground held water through Monday, September 28, and into early Tuesday, September 29, about two and a half to three days in all.
The maps
The first map shows NOAA’s modeled flood footprint (blue) alongside the areas and movement I observed. The blue footprint closely resembles the flooding I saw walking Cherry Grove during and after the storm. The second map shows NOAA’s high-tide flooding reference (red).
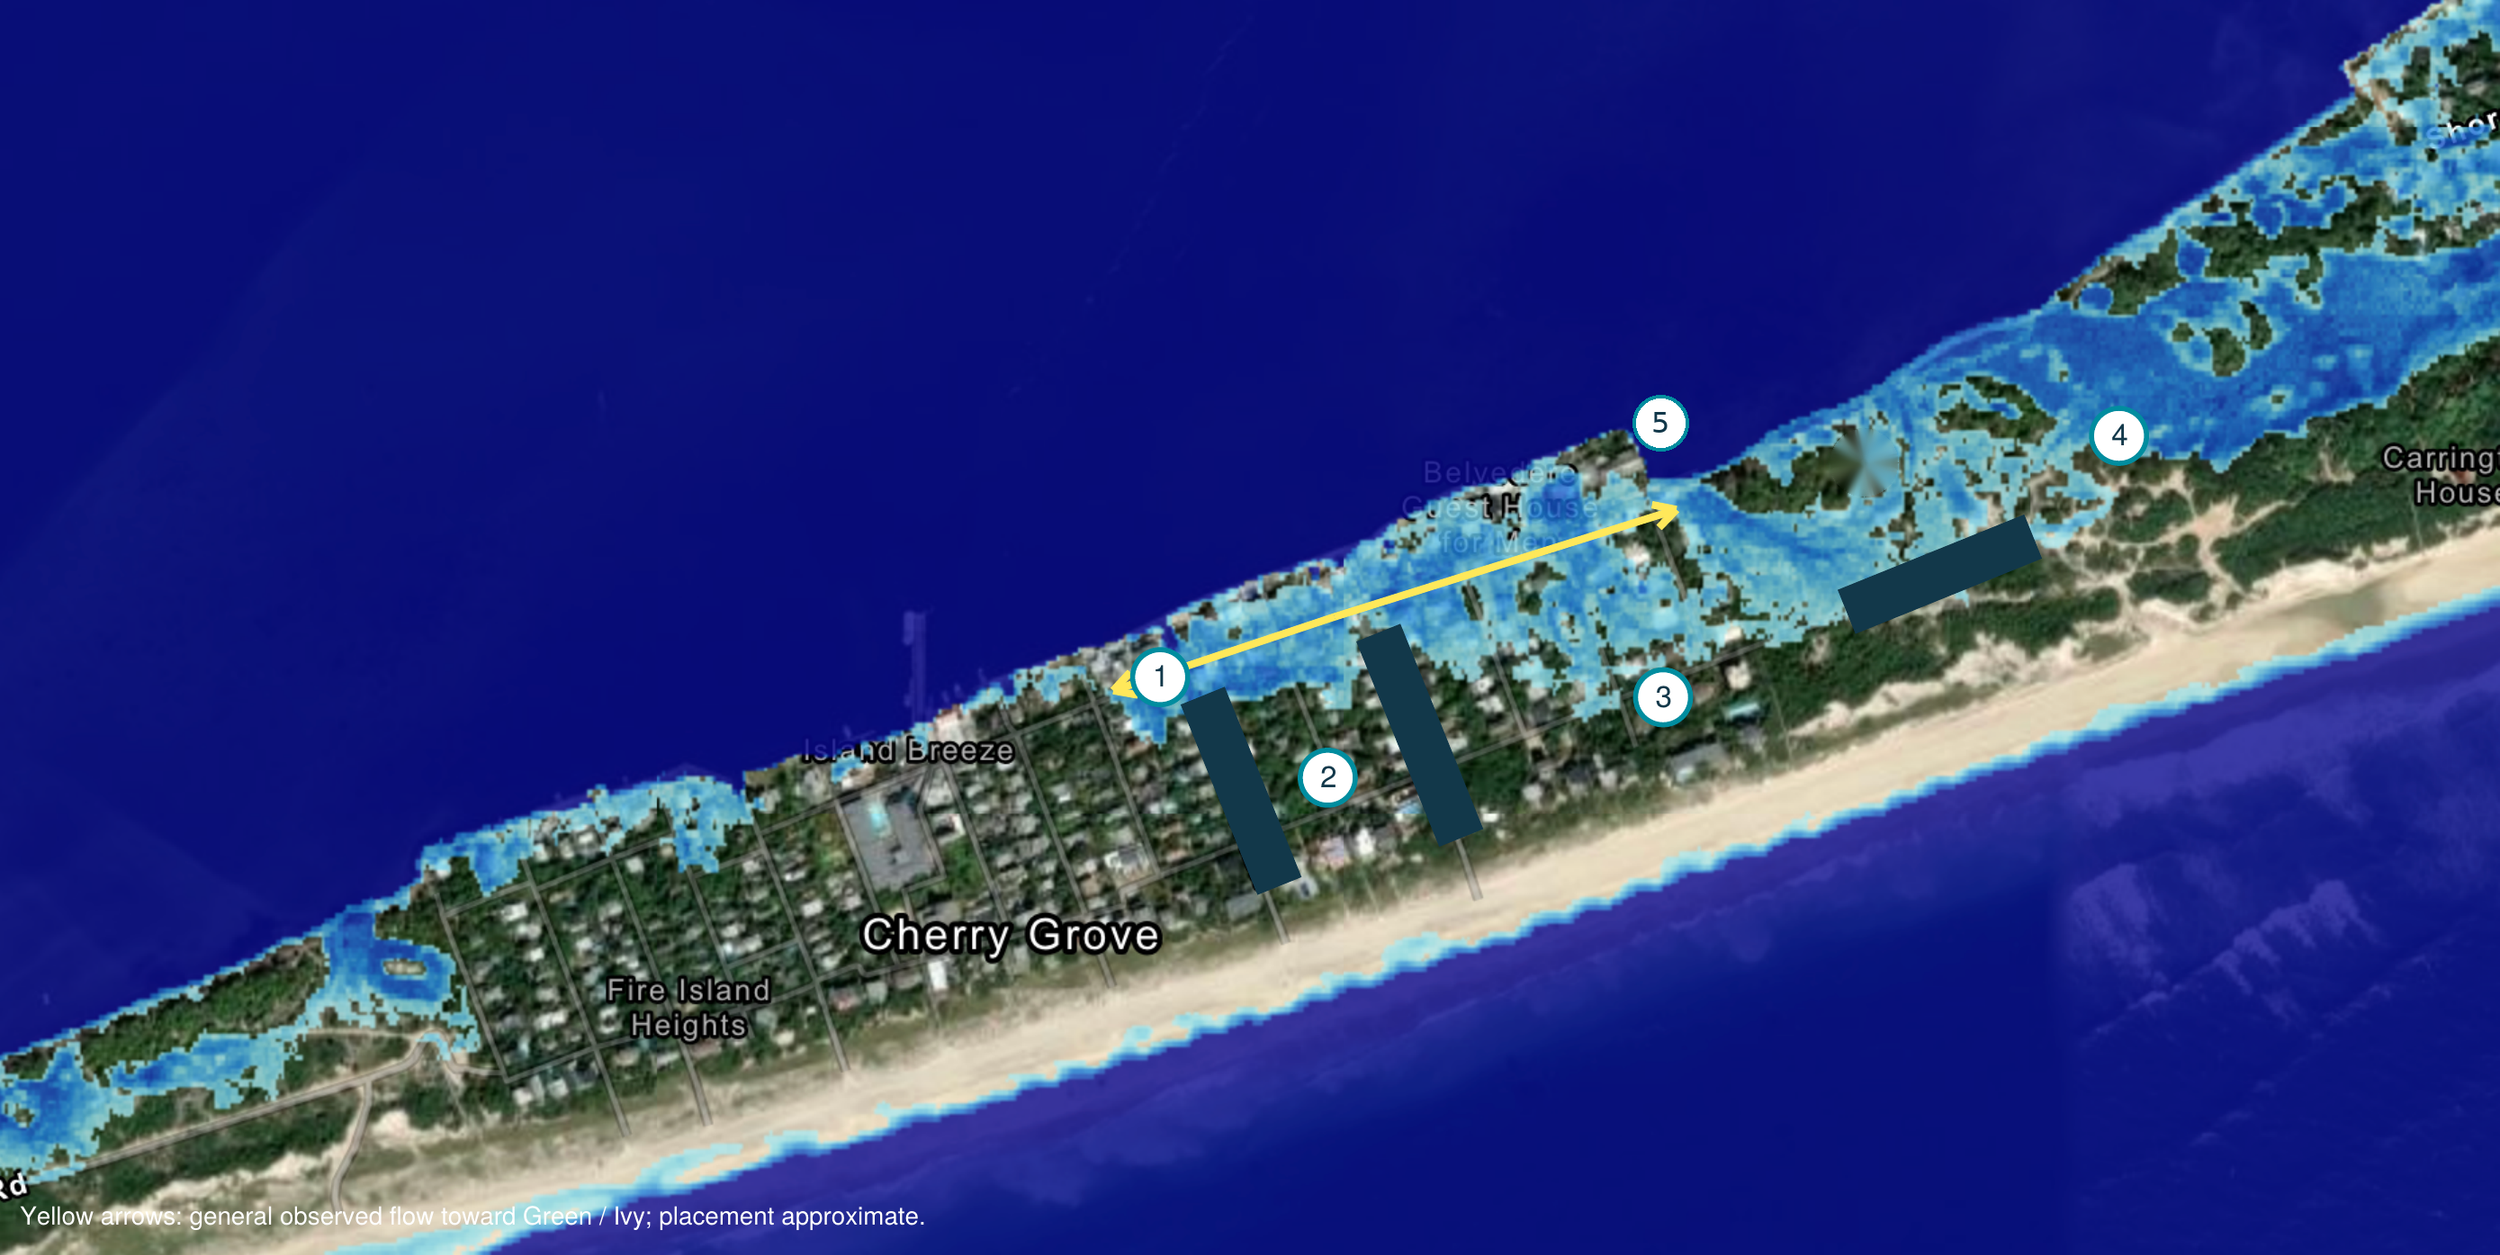
Map 1: NOAA Inundation Layer and Observed Flooding
Cherry Grove, September 26-29, 2026
Caption: NOAA inundation layer (blue) compared with flooding I observed in Cherry Grove. Flow directions, locations and depths are approximate.
Key
1. Bayview corridor. Flooding on both sides from Greene to Ivy. At the peak, water was about knee depth above the boardwalk just before Gerard. That depth applies to the Gerard area, not the center of the numbered circle.
2. Greene, Gerard and Aeon. Water extended south to the third dune rise. This is an observed limit, not a surveyed contour.
3. Maryland, Sumner and Lewis. Flooding reached almost to Lewis, with patches along Lewis toward Carrington. Some ground depths were about a foot or more.
4. Carrington Tract. Flooding observed. This is a locator, not a delineated wetland or storm boundary.
5. Ivy Walk and Bayview corner (erosion spot). Bay water can enter here at peak high tide. Marker position is approximate.
Yellow arrow: general observed flow in both directions along Bayview. Placement is approximate.
Blue: NOAA 2.5-foot scenario above mean higher high water. It does not show uniform yard depth or a measured storm level. Source: Base map from the NOAA Sea Level Rise Viewer (coast.noaa.gov/slr). Observations and arrow by Todd Erickson.
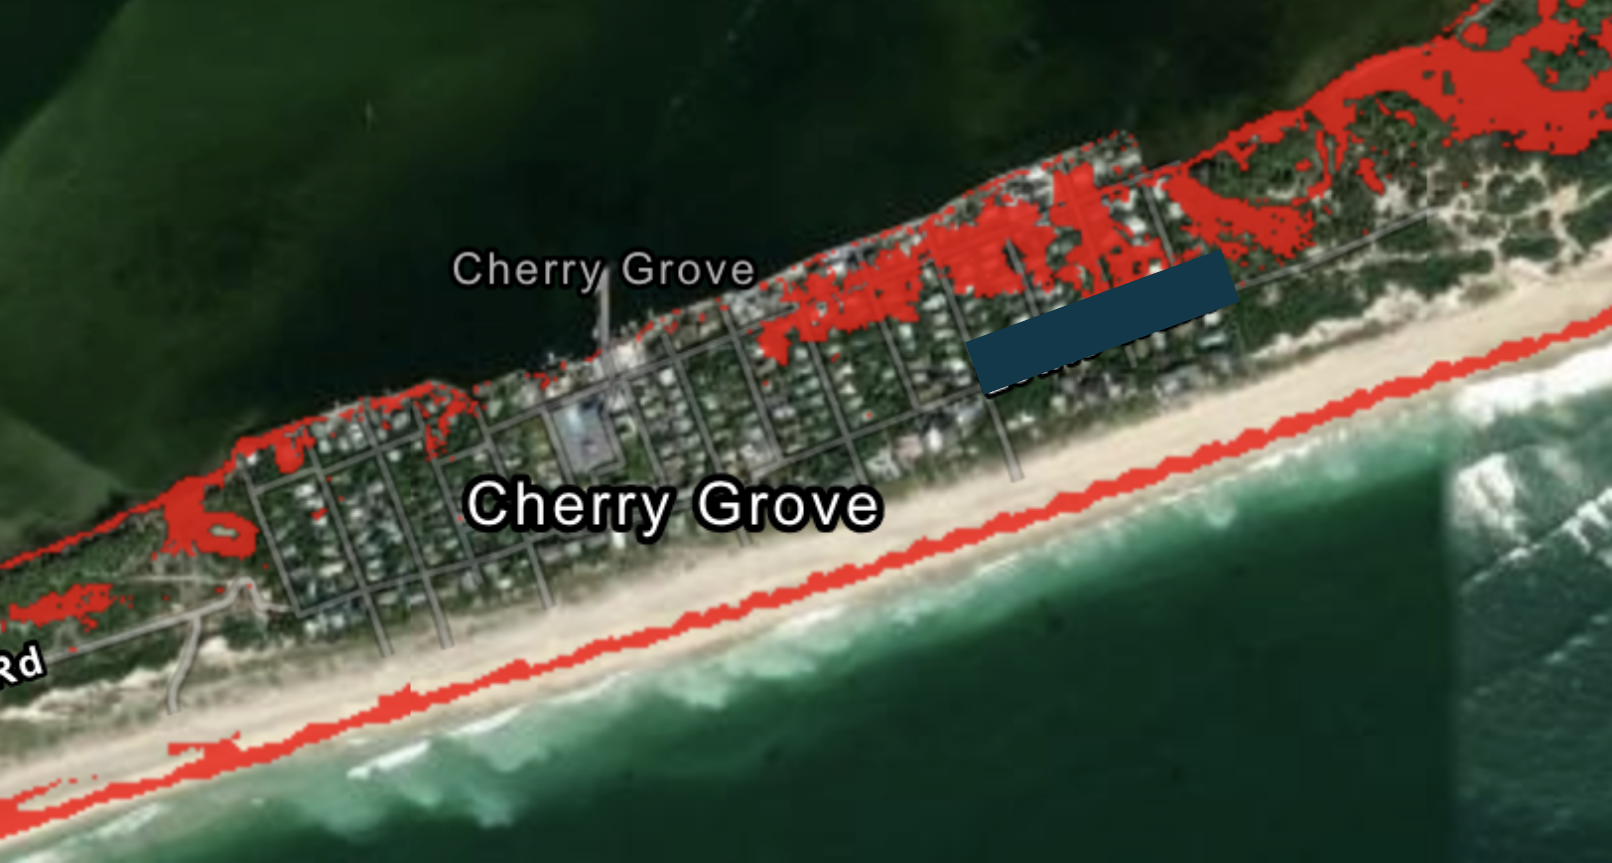
Map 2: NOAA High-Tide Flooding Reference
Cherry Grove
Caption: NOAA high-tide flooding reference layer (red) for Cherry Grove. This is a modeled reference, separate from the flooding I observed in September.
Red: Areas potentially susceptible to high-tide flooding, as modeled by NOAA.
Note: Exact bulkhead overwash points and flood edges were not surveyed. No published wetland delineation is shown.
Source: NOAA Sea Level Rise Viewer (coast.noaa.gov/slr).
Understanding the land
This event made the connections within Cherry Grove’s low ground visible. Water crossed property lines, gathered beneath and around the walks, and filled depressions reaching toward Carrington. The pattern helps us see the relationship between developed properties and the community’s wetland and dune terrain.
I am not addressing solutions here. In my opinion, certain elements of modern development can add to the damage homeowners experience in these storms, and that deserves a broader, more focused conversation in a future report.
For now, let us understand the wetland better: where water returns, how it moves through the community, and what its presence reveals about the land we live on.
Todd Erickson | Ecological Landscape Designer & Horticulturist
Notes and limits
My observations. This report is my recollection and field observation of the landscape, not a formal record of flood frequency. Depths and locations are estimates. The knee-depth reading on Bayview is measured above the boardwalk, which is a separate reference from depth above the ground.
What I could not measure. I did not measure the separate contributions of shallow groundwater, rainfall and direct bay inflow. I could see water spreading, moving and lowering, but not every route by which it left. Some returned toward the bay, and some may have soaked into the sand or moved underground. The balance among these remains unmeasured.
Tide reference. Predicted high tides at Democrat Point, Fire Island Inlet (local Eastern Daylight Time; September 26 was the full moon):
Event 1: Friday, September 25, 7:00 p.m.
Event 2: Saturday, September 26, 7:22 a.m.
Event 3: Saturday, September 26, 7:39 p.m.
Event 4: Sunday, September 27, 7:57 a.m.
Event 5: Sunday, September 27, 8:18 p.m.
These are predictions. They exclude the storm’s added water level and are not verified high-water times for Cherry Grove. I have not matched the two overwash cycles I observed to specific predicted tides. Predicted morning high-tide heights stayed elevated through September 29, so the recession cannot be explained simply by astronomical tides getting lower. Source: tideslegacy.mobilegeographics.com.
About the maps
The blue layer shows water 2.5 feet above mean higher high water. That does not mean every blue area held 2.5 feet of water; modeled depth varies with elevation.
The red layer shows areas potentially susceptible to high-tide flooding. It is a modeled reference, separate from the observed storm extent.
NOAA describes its layers as planning references and excludes wind-driven tides from its sea-level-rise visualization (coast.noaa.gov).
The resemblance between the blue footprint and what I observed does not establish the storm’s actual water level or prove that every modeled area flooded.
Numbered locations and arrows mark the areas and general movement described here, including the Ivy Walk and Bayview corner. They are approximate field observations.
Neither the NOAA layers nor the observed footprint is a surveyed wetland boundary.